HEART RATE VARIABILITY AND RECOVERY
UNDERSTAND YOUR RECOVERY AND FIND THE BALANCE BETWEEN STRAIN AND REST
It all starts from your baseline
RMSSD* is a value (milliseconds) calculated from heart-rate-variability (HRV). You can use it to monitor your daily training load and nightly recovery. They key here is knowing your own baseline – the values you usually get – which becomes more evident after you have been tracking your HRV for a while. Knowing your baseline helps you to interpret your nightly HRV values. HRV is highly individual, and for healthy people it typically fluctuates around 20 to 50, maybe even 50-80. For athletes it can be high. In the long term, low values below 15 or so can indicate stress, for example. Very high values around 90-100 or even higher can also be seen with heart beat irregularities. After all, HRV is about changes in between beat-to-beat time in milliseconds. Our HRV histogram and trends help you to learn what your baseline is, which makes it easier for you to notice changes. In the following, we’ll show you how to interpret your HRV data and learn from it.
*Root Mean Square of the Successive Differences (RMSSD) is one of a few time-domain tools used to assess heart rate variability, the successive differences being neighboring RR intervals.
See how your mental and physical strain are reflected in your recovery
Interpreting recovery data
Heavy strain – training and/or stress – lowers your HRV RMSSD value, while nightly recovery increases it. If your evening HRV value is low, you know your training that day was effective. If your morning value is high, you are recovered and ready for another heavy exercise, for example. On lighter days with less strain, HRV is usually higher in the evening than in the morning, which is normal too! However, if you’ve been straining your body or mind very hard lately and your HRV doesn’t seem to reach your normal higher values for a longer period of time, your body may be telling you it needs more rest to recover properly. That is your cue to take it easy for a bit to avoid straining your body or mind too much. To perform at your best, you also need to rest. See the examples of different nightly HRV trends below and learn how to interpret your HRV data!

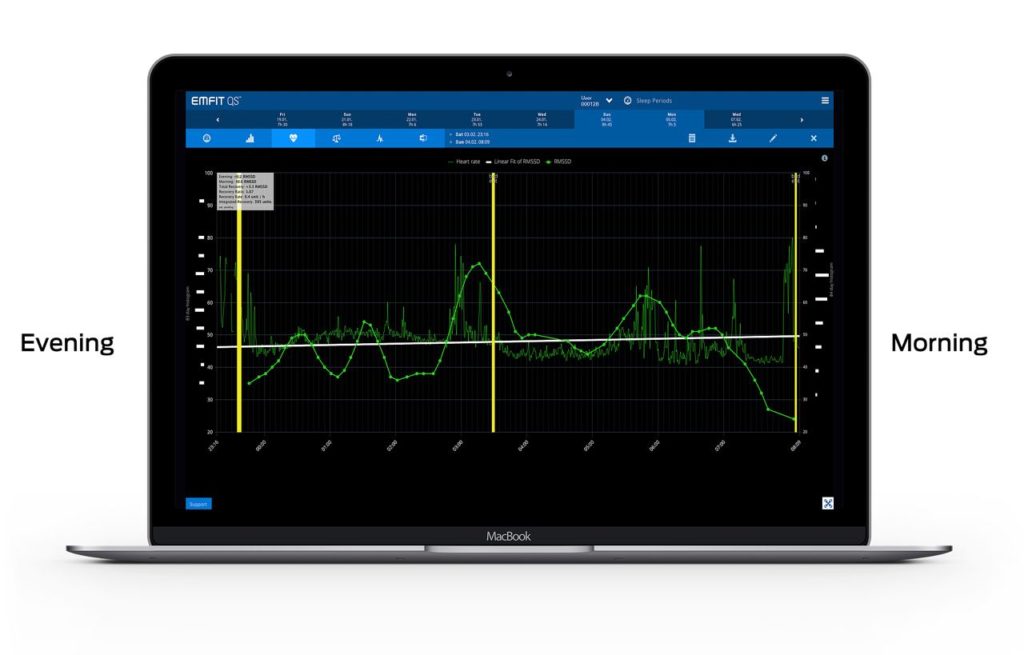
Increasing HRV from evening to morning
In this example, the evening value of the linear fit (the straight white line) RMSSD value is located just below the longest histogram bar of historical values (white bars on the left side). It could indicate the day was maybe a bit heavier or more stressful than usual. The morning value is higher than the longest bar on the morning histogram (white bars on the right side). That indicates better than usual recovery. Recovery Ratio values higher than 1 are “good”. Values clearly below 1 are not so good.
Neutral HRV throughout the night
In this example, the evening value is somewhat higher – perhaps after a lighter day. There simply is not much need for recovery. Early in the night, there is more variation in RMSSD values, and these cease towards the morning. This may indicate the body is ready to wake up. After light day, a low Recovery Ratio and a low Total Recovery are usual and not a bad thing at all.
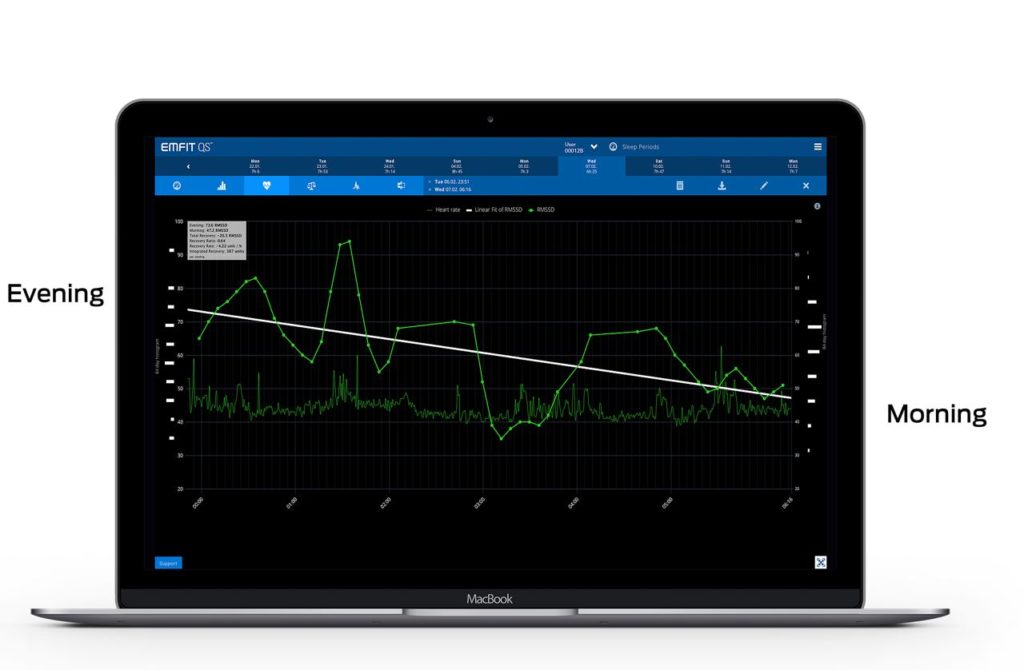
Decreasing HRV towards the morning
In this example, the evening value against the historical values is clearly higher than usual. It could indicate a heavy or stressful day. It even goes down towards the morning and is clearly lower than historical values. A downward trend like this, compared to historical values, could indicate stress. For example, work related matters may start spinning around your head in the morning hours. It could also mean some physical is problem arising – a sickness perhaps.
Start seeing correlations and learn what your body needs
We're not all the same
HRV numbers are highly individual and you alone know best what is going on in your life. That is why you need to self-reflect a little while interpreting the data. The notes function on our web app can help you to keep track of what you’ve been doing and what is going on in your life. Or maybe you already keep a diary in some other form. Anyway, being aware of what’s happening in your life while looking at your data helps you to spot correlations and to learn from them. You might notice the positive effect of a long walk in the forest on your stress levels or what a night out drinking does to your recovery data. Spotting such correlations can be very enlightening and can teach you what your body does – or doesn’t – need. Then it is up to you what you do with that insight.